Top 3 Price Prediction Bitcoin, Ethereum, Ripple: BTC eyes big price changes amid shrinking volatility
Top 3 Price Prediction Bitcoin, Ethereum, Ripple: BTC eyes big price changes amid shrinking volatility
CRYPTOS | 07/17/2023 18:24:52 GMT
Bitcoin price eyes big price changes, either up or down, as volatility shrinks.
Ethereum price eyes 5% losses as ETH tests crucial support at $1,907.
Ripple price fills up a pennant as XRP readies to reveal which way the breakout will go.
Bitcoin (BTC) price has traders guessing as it continues range-bound and moving horizontally. The price action, which suggests shrinking volatility, holds the entire altcoin ecosystem hostage, with Ethereum (ETH) and Ripple (XRP) prices trading only marginally.
Bitcoin price eyes big changes
Bitcoin (BTC) price shows a shrinking volatility, suggesting a big incoming price change to either upside or downside. The price is moving within a short leash, capped at $31,500 and $29,872 to the upside and downside, respectively. A decisive break and subsequent candlestick close above or below the range will decide the next direction.
Top 3 Price Prediction Bitcoin, Ethereum, Ripple: BTC eyes big price changes amid shrinking volatility
CRYPTOS | 07/17/2023 18:24:52 GMT
Bitcoin price eyes big price changes, either up or down, as volatility shrinks.
Ethereum price eyes 5% losses as ETH tests crucial support at $1,907.
Ripple price fills up a pennant as XRP readies to reveal which way the breakout will go.
Bitcoin (BTC) price has traders guessing as it continues range-bound and moving horizontally. The price action, which suggests shrinking volatility, holds the entire altcoin ecosystem hostage, with Ethereum (ETH) and Ripple (XRP) prices trading only marginally.
Also Read: Whales are secretly accumulating these two DeFi coins: LINK, UNI
Bitcoin price eyes big changes
Bitcoin (BTC) price shows a shrinking volatility, suggesting a big incoming price change to either upside or downside. The price is moving within a short leash, capped at $31,500 and $29,872 to the upside and downside, respectively. A decisive break and subsequent candlestick close above or below the range will decide the next direction.
With momentum indicators pointing to declining buying pressure, Bitcoin price could break below the lower support level at $29,872. Notably, much uncollected liquidity is underneath this level, which acts as a downside pull for BTC as traders wait for ideal entry positions.
Therefore, a decisive break below the crucial support at $29,872 could see Bitcoin price pull lower toward the $27,500 range. The Relative Strength Index (RSI) and Moving Average Convergence Divergence (MACD) indicators both point south, suggesting falling momentum.
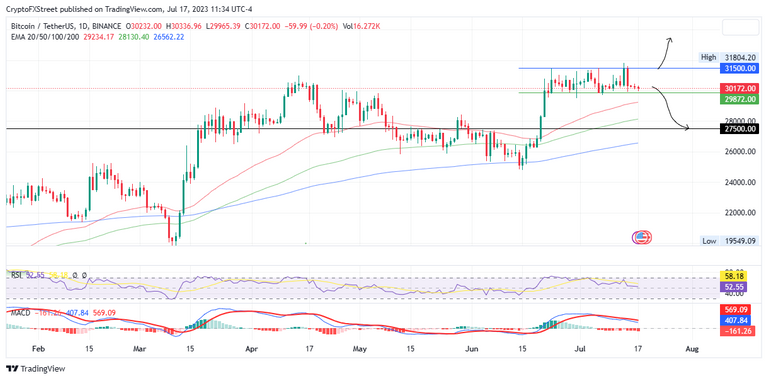
BTC/USDT 1-Day Chart
The 50-, 100-, and 200-day Exponential Moving Averages (EMA) at $29,235, $28,130, and $26,562 all provide entry positions for sidelined investors or those looking to grow their portfolios. As Bitcoin price slides below the critical support, the ensuing buying pressure from these levels could provide more hind winds for BTC to restore north, potentially shattering the $31,500 level to confirm an uptrend.
Ethereum price tests critical support
Ethereum (ETH) price is testing crucial support as the downtrend continues. At the current price of $1,907, the largest altcoin by market capitalization is on the brink of breaking below its bullish consolidation along the uptrend line or continuing posting gains above it.
Momentum indicators, comprising the RSI and MACD, point to a drop unless bulls seize the current low-risk buying opportunity to reject the downside. If conservative trading prevails and bulls sit on their hands, a confirmed break below the ascending trendline could open the drains for ETH. This could see the altcoin tag the 50-day EMA at $1,868 or, worse, re-register the July 7 lows around $1,824. This is marked by the support confluence between the 100-day EMA and the horizontal line, making it a robust buyer congestion zone.
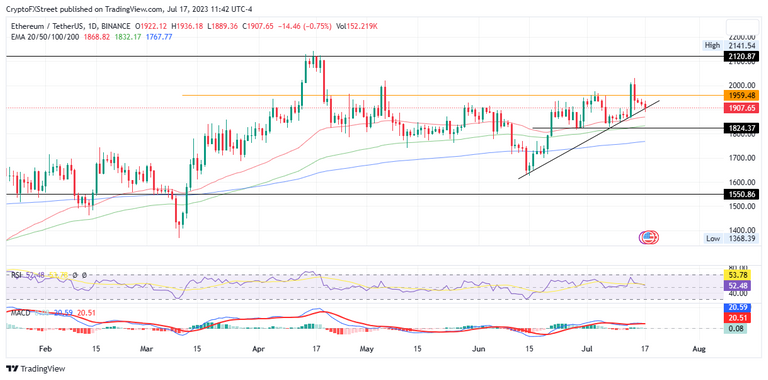
ETH/USDT 1-Day Chart
Conversely, buying pressure from the EMAs could facilitate a north swing, sustaining ETH’s move along the uptrend line and ultimately breaching the $1,959 resistance level. In highly ambitious cases, the Proof-of-Stake (PoS) token could reclaim the mid-April highs around the $2,120 mark.
Ripple price trades marginally as consolidation climaxes
Ripple (XRP) price is filling up a pennant, trading in a steadily narrowing. With neither bulls nor bears giving way to their trading positions, the pennant decides which way this tug-of-war will go.
Notably, however, there are already small spillages below the support offered by the uptrend line of the pennant. This suggests bears might have a better and tighter grip on Ripple price.
This gloomy outlook is reflected by the RSI, showing a bearish divergence against the Ripple price. This comes as XRP records higher highs along the lower boundary of the pennant, while on the other hand, the RSI is showing lower highs.
The odds, therefore, favor the downside suggesting an imminent retest of the mid-July lows around $0.697. A decisive 4-hour candlestick close below this level will confirm the downtrend.
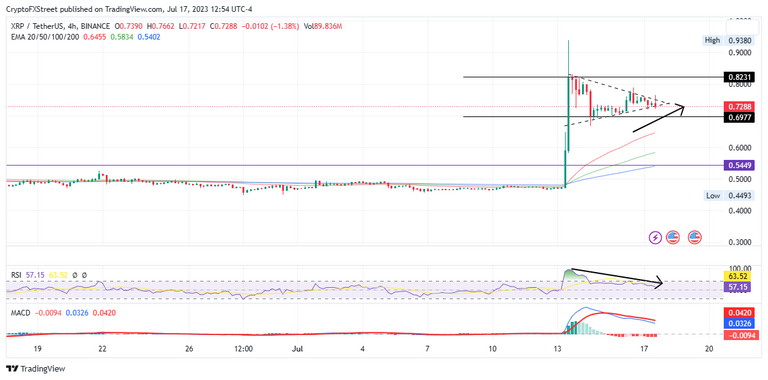
XRP/USDT 4-hour chart
On the other hand, if late investors buy the remittance token, the Ripple price could break the pennant to the north, making a run for the peak of the technical formation at $0.823. Such a move would denote a 15% climb from the current level.
!MEME
Credit: jomancub
Earn Crypto for your Memes @ HiveMe.me!
Source of potential text plagiarism
Plagiarism is the copying & pasting of others' work without giving credit to the original author or artist. Plagiarized posts are considered fraud. Fraud is discouraged by the community and may result in the account being Blacklisted.
Guide: Why and How People Abuse and Plagiarise
If you believe this comment is in error, please contact us in #appeals in Discord.