Steem Engine Tokens Price Charts
Steem Engine tokens have been around for a couple of months now. There is still not many tools and interfaces about their prices. Its all very new with low volume and high volatility.
I have to thanks @harpagon for making the steem-engine api with the historical data on tokens prices as explained in this post. I have extracted the data for the charts below from there. Still struggling to get a clean data on prices from the blockchain itself and hopefully will do it soon.
Data on the most popular tokens will be presented below. Tokens included are:
- PAL
- SCT
- LEO
- DEC
- SPORTS
- CCC
- NEOXAG
- SPT
- GG
- ACTNEARN
First a chart with the daily average on all the tokens above starting from 08/01/2019. Some of the tokens are created in august and because of it the chart is starting from august. Prices are in STEEM and daily.
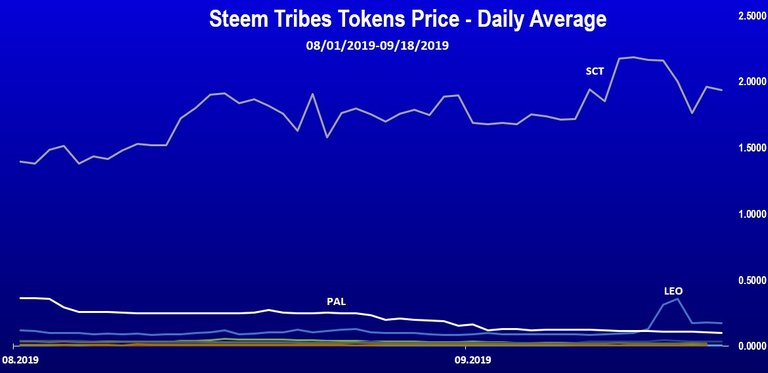
This is an effort for prices comparison of the tokens but obviously not much readable. The SCT token is there on the top and PAL and LEO have some visibility as well. The res are all on the bottom and not much can be seen.
Here is the same chart excluding the SCT token.
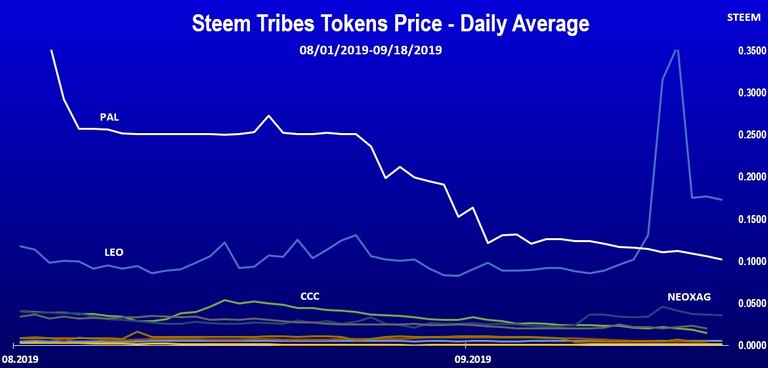
The CCC and NEOXAG emerged from the bottom but still not much can be seen.
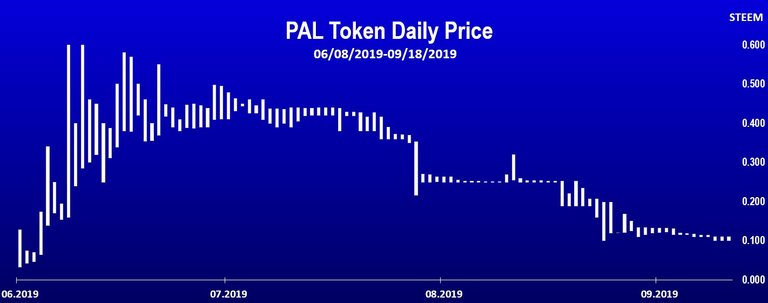
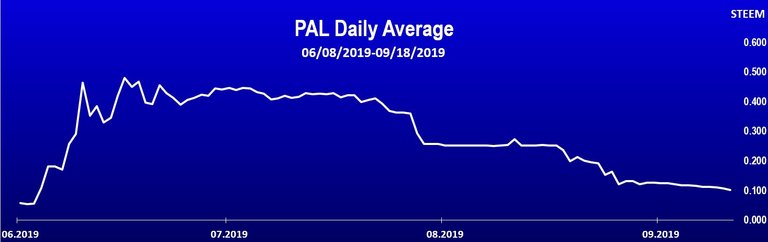
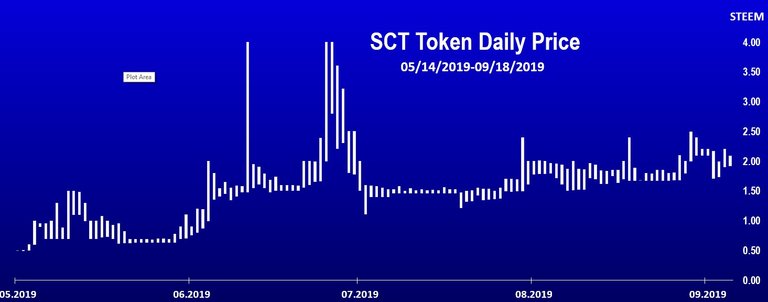
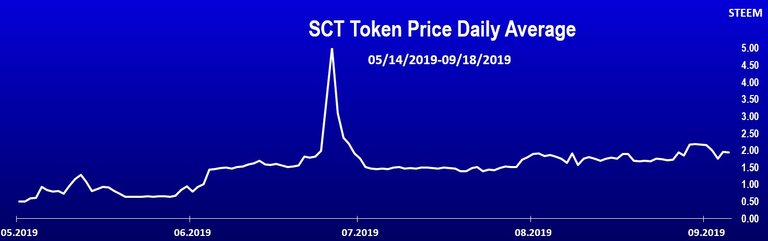
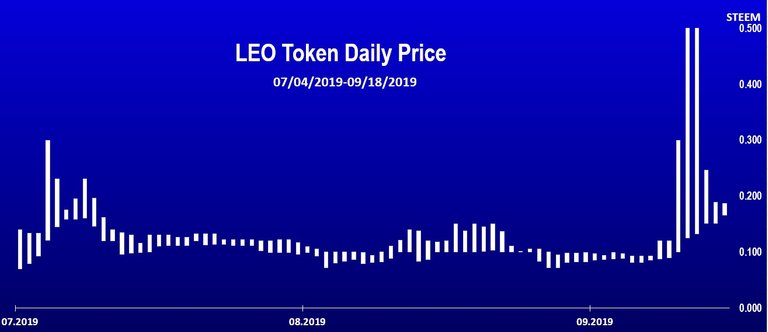
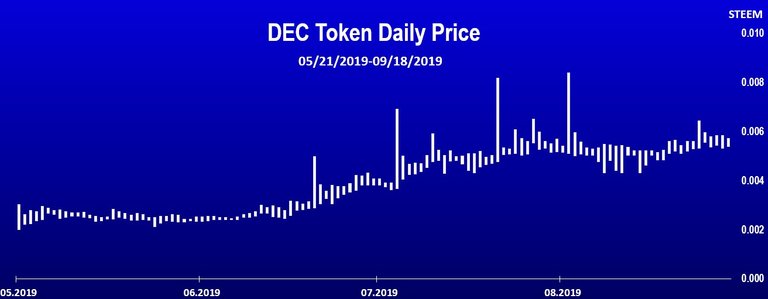
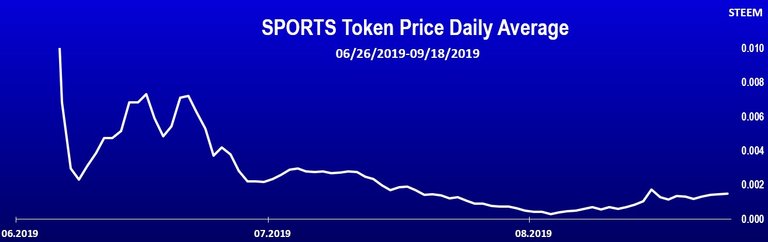
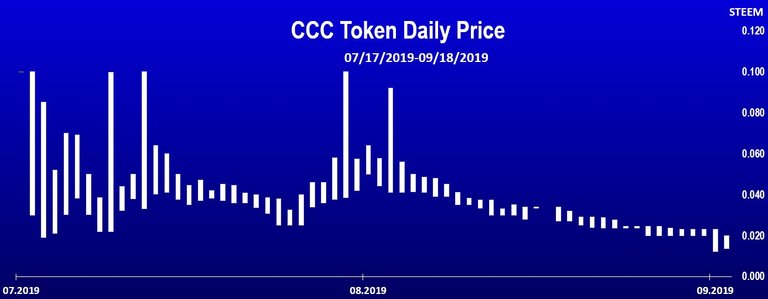
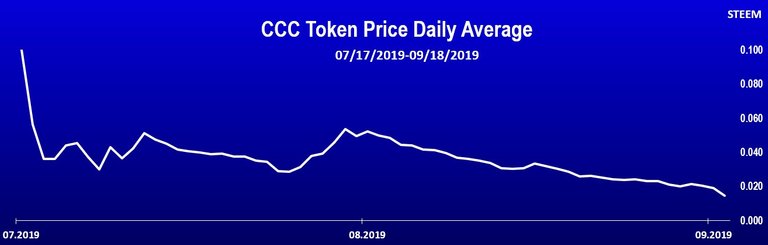
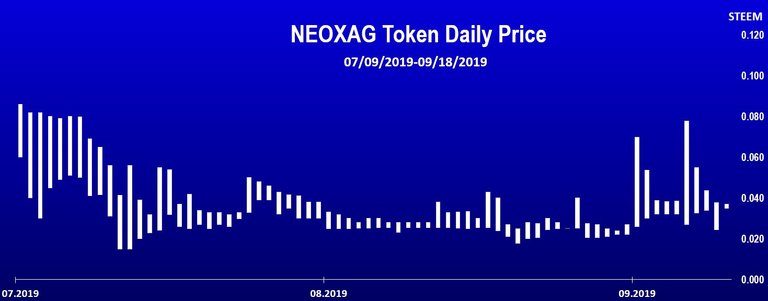
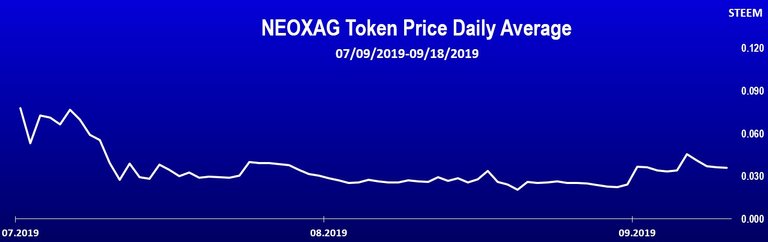
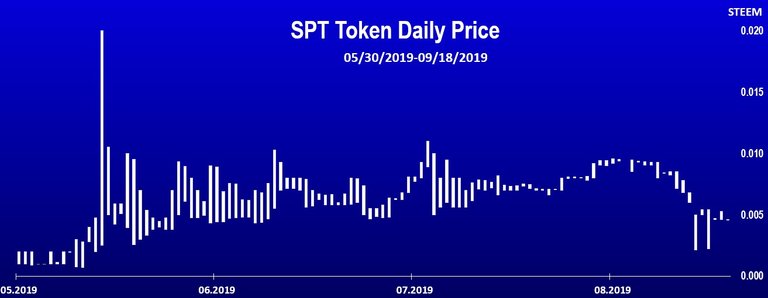
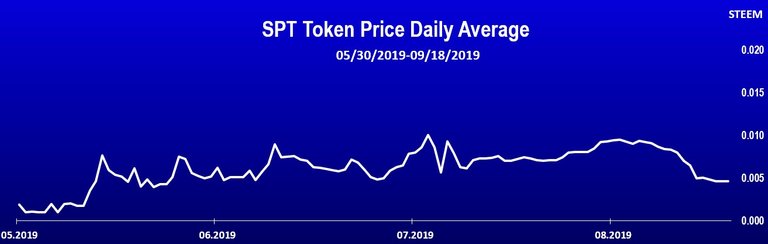
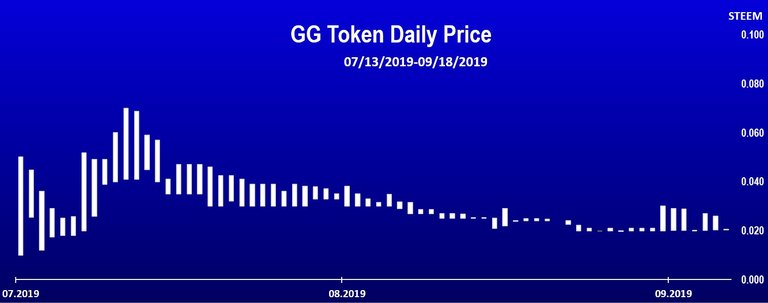
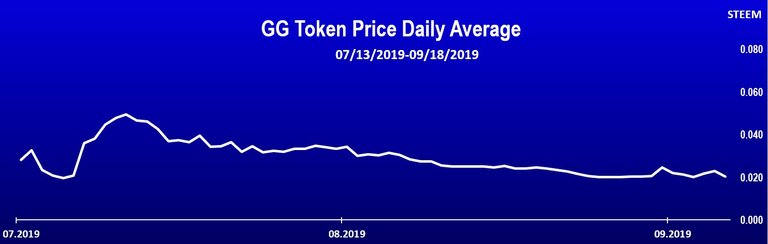
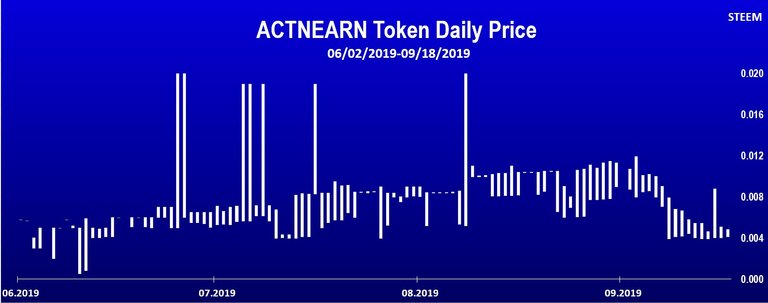
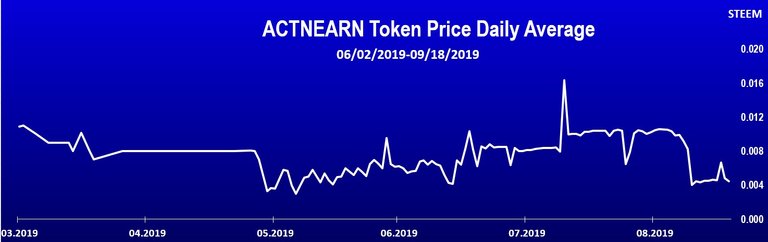
Next are the individual charts on each token. There is a chart with the average price and a candle like one. The candle is just for the high and low for the day, without open and close data.
PAL
SCT
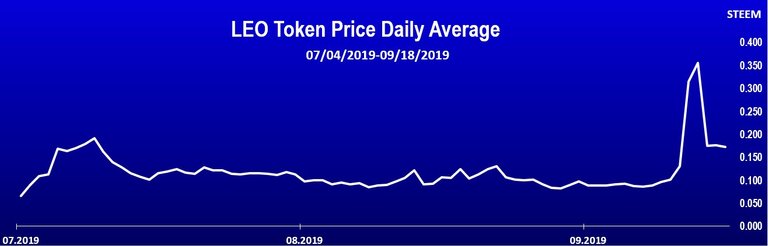
LEO
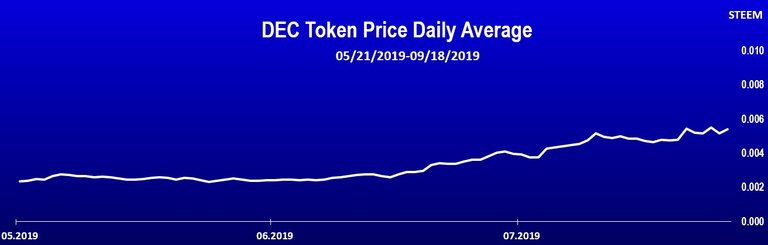
DEC
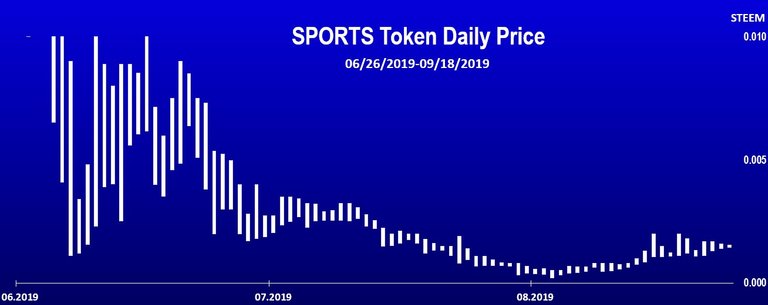
SPORTS
CCC
NEOXAG
SPT
GG
ACTNEARN
Looking forward for some Technical Analysis from the skilled ones out there :D.
All the best
@dalz
태그 작성 가이드라인 준수는 콘텐츠 관리와 글에 대한 접근성을 높이기 위해 반드시 필요한 절차입니다. ( It is an essential step to adhere tags guideline, manage content and make access better to your postings.)
스팀코인판에서 활용 가능한 태그는 크게 [보상태그 / 언어태그/ 주제태그]로 구분할 수 있습니다. 보상태그와 언어태그는 필수입니다.(Tags that can be largely grouped into [Main Community / Language / Topic] in community. The language and topic tags are required.)
(예) 한국어로 작성한 자유 주제 포스팅((E.g) Posting for free topic in English)
Your post has been upvoted by us in cooperation with @bdcommunity.
Thanks!
A little bit strange that dec is doing okay, while spt is one of the worst pupils of the class!
But your post of yesterday does explain this for a bit!
SPT is not that bad .... it is quite stable .... PAL has keep falling and that is a bit worissome since it is the frontruner of the tribes ... the SCT comunitie is in their own league ...
I really don't know shit about the sct community. I know it is Korean and that it gives great steem upvotes!
:) Preaty much the same .... they are not very inclusive for non Koreans.... oh and this 50% of the Steem volumes on exchanges comes from Korea
Hi, @dalz!
You just got a 13.05% upvote from SteemPlus!
To get higher upvotes, earn more SteemPlus Points (SPP). On your Steemit wallet, check your SPP balance and click on "How to earn SPP?" to find out all the ways to earn.
If you're not using SteemPlus yet, please check our last posts in here to see the many ways in which SteemPlus can improve your Steem experience on Steemit and Busy.
Hi @dalz!
Your post was upvoted by @steem-ua, new Steem dApp, using UserAuthority for algorithmic post curation!
Your UA account score is currently 3.763 which ranks you at #5300 across all Steem accounts.
Your rank has not changed in the last three days.
In our last Algorithmic Curation Round, consisting of 115 contributions, your post is ranked at #79.
Evaluation of your UA score:
Feel free to join our @steem-ua Discord server
Thanks for this update now I know the coins to invest in this month end b4 the price moons. Coins to watch out for are;
Especially SPORTS and leo for traders it will give good ROI
Did you take the code any further? I would love a real time embed I could use to show the current price of our token, ATOM, on our website and in our Discord.
Well a python code is possible but don't know how to transfer that to a web interface.
@gerber has already made a bot to display prices in the steemleo discord.
Thanks. I actually managed to find info on the API and coded something: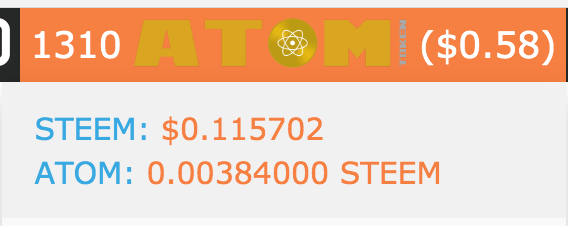
I also created a widget for anyone to use
Nice!